Edit & Debug
The Edit & Debug screen provides all the features to make a test and/or to debug it. It contains a Script editor that prevents syntax errors so you will be able to create flawless Test Scripts.
A complete test (a Test suite) consists of a series of successive tests (Test scripts) that activate the electronic functions of a PCB and check whether they function as required.
The Edit & Debug section will only work fully when the right PCB is selected in the PCB manager section and the assigned Test Heads are connected to the PCB.
You can write and edit Test Scripts without connected Test Heads, but in this mode you will not be able to run or monitor tests.

In the Edit & Debug screen there are 4 sections:
- Script Section
- Real Time Input and Output Section
- PCB/Test Head Detect & Test Section
- Command Section
Always present on the lower green ribbon are:
(X) Log File: When a test is run, contents of the log screen are copied in a log file. Clicking here will open the log file.
The log file is stored in the PCB”s script directory and will be overwritten every time a new test is run. See also Log file
(Y) Footprint: Download the lay out for the footprint (Eagle)
(Z) Support: Link to the support page of TEST-OK, see Support
Test Heads with Footprint
Every Test Head and corresponding Footprint provides a set of pins which are pre-processed for certain (test) function; Analog In- and Outputs, Digital In- and Outputs, Board detect, Power Supply, CAN Bus, 12C, RS485 and UART.
In order to address the right stimuli to the right pins you will create Test Scripts per pin (or set of pins) using prescribed Test Commands. Let”s give you a brief insight.
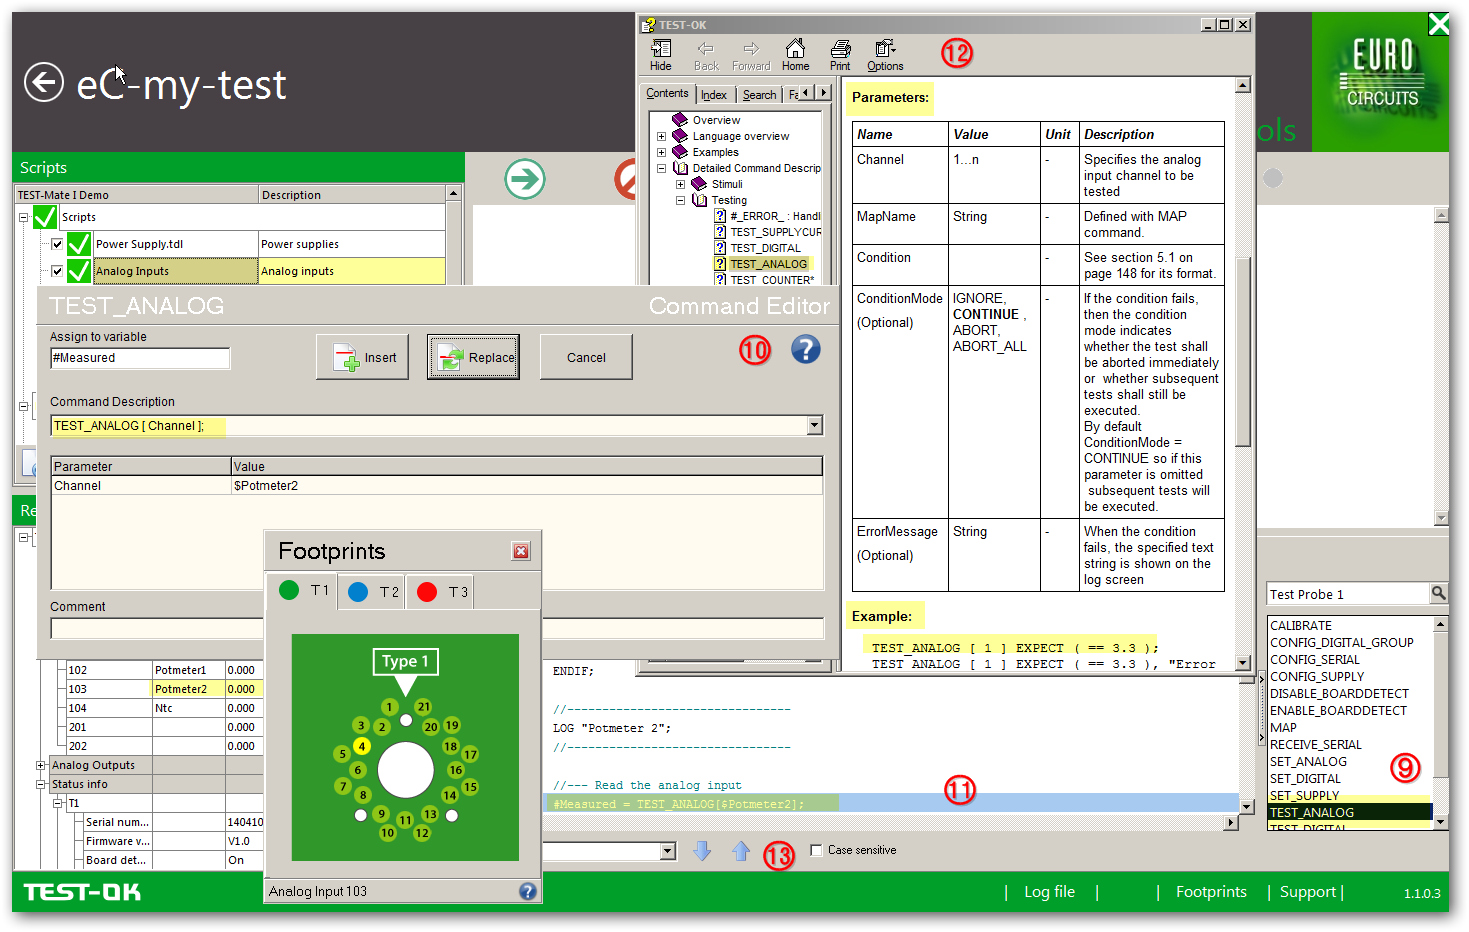
In the Edit&Debug screen click on Footprints… (1) and the Footprints Screen will pop up (2).
Choose the required Test Head (T1, T2 or T3) and click on the required test pin (3). In this case you want to create (alter) a Test Command line for test pin 4 (= Analog input 103 (4)) of Test Head T1 to calibrate potentiometer 2 on the Test-Mate Demo I PCB.
See in the Real time I/O the corresponding I/O of the pin (5). Double click on the pin (3) and all the specifications of the pin are shown (6) including the Associated Test Command(s) in the Prescribed Commands view section (7).
In the Command line view the Command lines of the Analog Input Script are visible (8)

Test Commands
eC-my-test provides an extensive library of prescribed Test Commands to create a Test Script for a test pin.
These Commands are listed in the Prescribed Command view. Let”s give you a brief insight.
Click on the Test Command (in this case TEST _ANALOG) (9) and it will open to the Command Editor (10) where values and parameters can be assigned and modified.
Double clicking on the relating Command line in the Command line view (11) opens to its related settings in the Command Editor.
Click on the HELP on the Command Editor and a detailed Command description (12) is provided including the relating parameters and useful representative examples.
For searching words and/or test commands in the Command line view, use the search box (13).
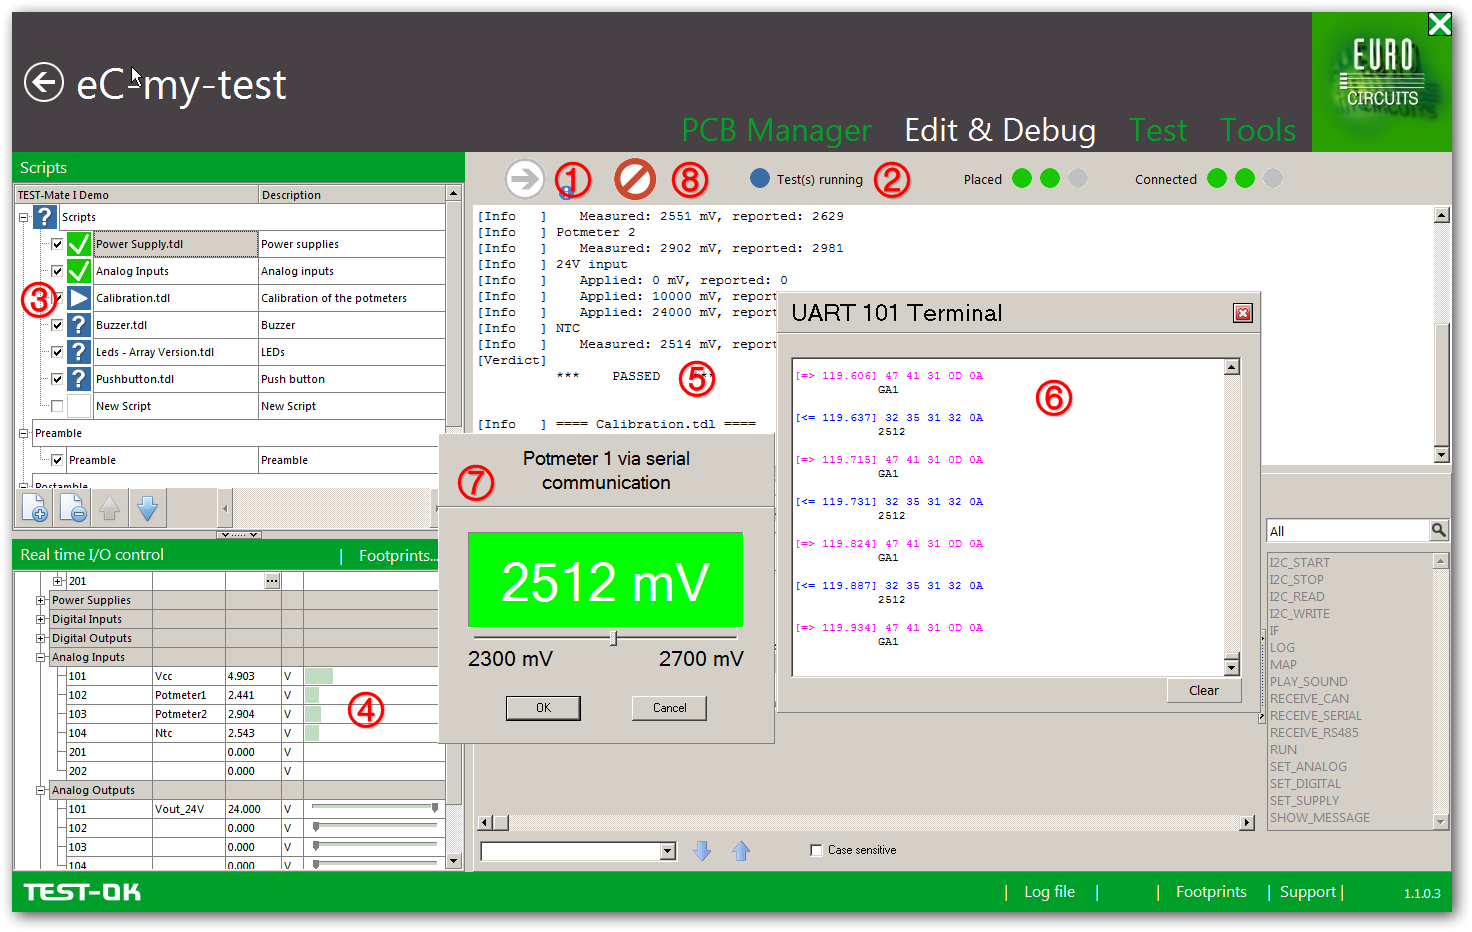
Running and debugging a Test
When a Test Script is created, a test can be run to see if the settings are correct.
During the test it is possible to make changes to the Test Script as a result of the outcome of the test (debugging). A brief insight.
Connect the assigned Test Heads to their correct Footprints on the PCB.
In this case T1 on the PCB TEST-Mate I Demo PCB (Starter Kit). Click on the Run Test Button (1) (only available when the Test Heads are connected to the PCB).
The complete Test Suite for PCB TEST-Mate I Demo will be executed. The Test(s) running status indicator (2) turns into blue and the test is running.
The marks in front of the Test Scripts (3) turn blue (with question mark) when activated, blue (with arrow) while running and green when tested correct or red when tested false.
When the test is running there are several in and outputs to view and control:
The test setting and values can be real time and controlled in the Real time I/O control Section (4).
The test results are real time shown in the Log screen (5).
An UART Terminal (opens by double click on the UART 101 Test Head in the Real Time I/O control Section) provides real time serial communication values (6).
Visual and aural controls can be assigned to the Test Scripts in order to ask a certain input from the operator.
In this example (Test Script Callibartion.tdl) the operator is asked to alter the settings for a potentiometer via serial communication (7). Bydoing so the values in the Real time I/O control are visual (4).
Here you see the value of case pin 102 with function Potmeter 1.
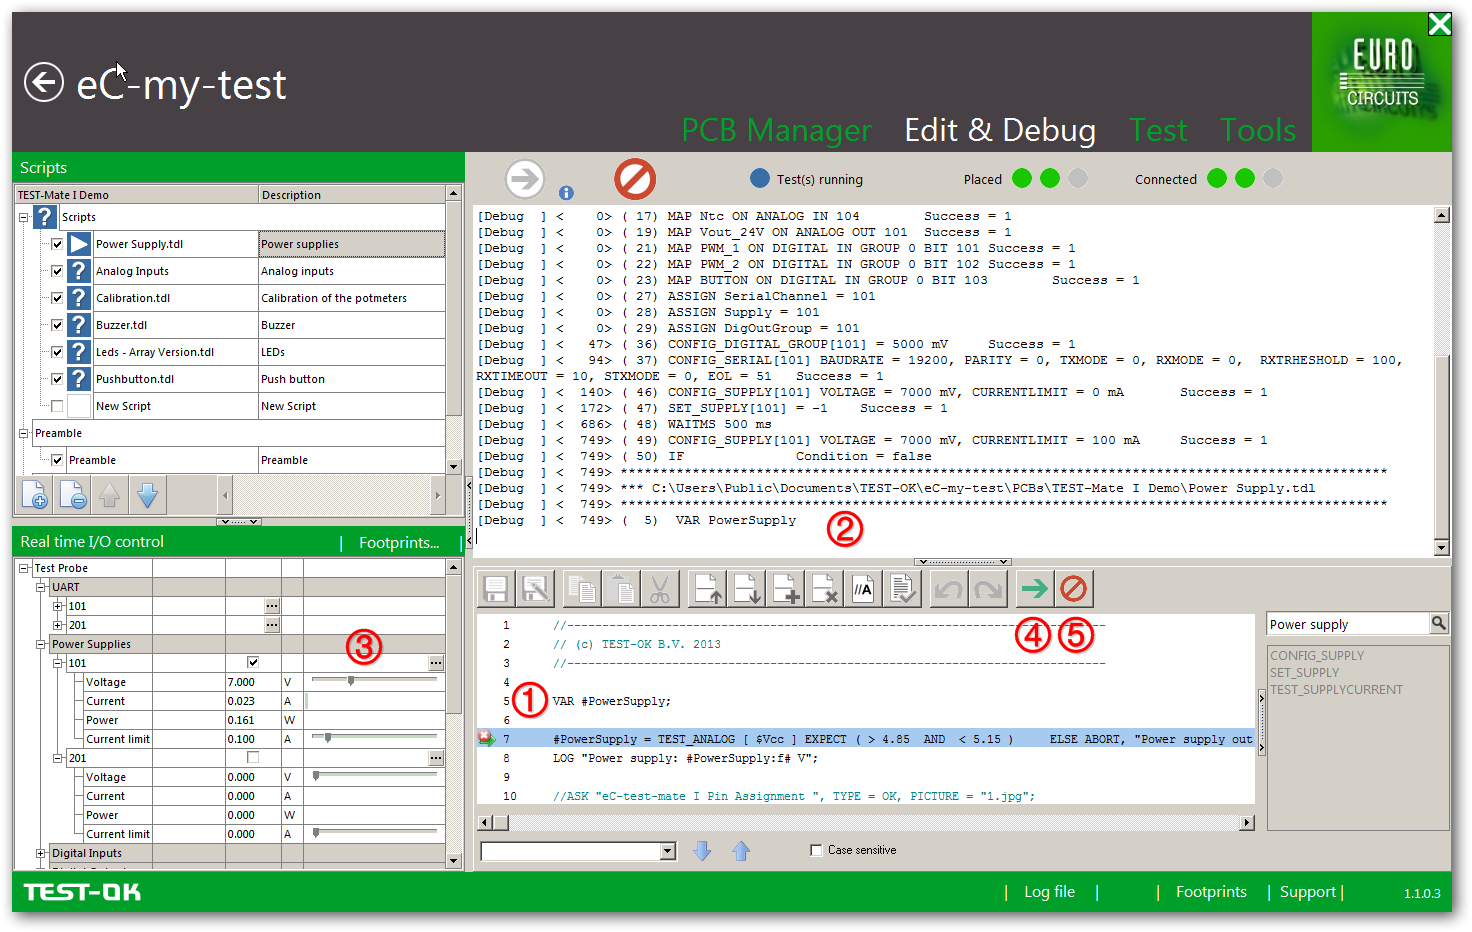
Breakpoints for debugging a test
For debugging a test it is very useful to run a single Test Script and stop ad a certain Command line to be able to freeze the actual in- and outputs.
For this purpose eC-my-test is provided with a so called Breakpoint function. A brief insight.
Choose the concerning Test Script to run (deselect the other Scripts) (2).
Double click in front of the Command line (1) in the Command line view, where you want the test to stop, to insert a Breakpoint; a small red cross will appear.
When running the test, execution will be halted on this line, allowing checking for example the values measured on the I/O control screen (3), or check functions on your PCB.

In this example a Breakpoint is inserted (1) and the Test Script “Power Supply” is halted on the current Command line which has a Breakpoint.
In the Log screen the debug message is shown (2), in the Real time I/O section the actual output is visible (3).
To continue the test click the arrow of the Command Buttons (4) and the Test Script will continue. To abort the test click on the abort button of the Command Buttons (5)
It is possible to set as many Breakpoints as required in the Test Script that is currently shown in the editor. When opening another script, all breakpoints are automatically cleared.
Clearing a breakpoint is done by double-clicking on the breakpoint symbol.